
2017 was yet another banner year for investors with the Standard & Poor’s 500 Index providing a total return of 21.8%. This same index has now annualized at a rate of 15.8% for the past five years! What’s your prediction for market returns in 2018? For those of you that know Multnomah Group well, you know that we do not believe in market timing. We believe long-term investment success boils down to simple concepts and discipline. Unfortunately, the all too rosy picture of continued financial market performance leads to poor decisions. In order to provide a more balanced view of the future, we provide for you the exciting topic of the Yield Curve.
Below is a graph pulled from the St. Louis Federal Reserve Bank’s website. This graph details the spread between the 10-Year Treasury Constant Maturity minus the 2-Year Treasury Constant Maturity. Within the graph are grey bars, which mark periods of recession. This graph goes back to the summer of 1976. There’s nothing special about that year for the purpose of this blog. (It’s simply the range that the website would allow me to graph.)
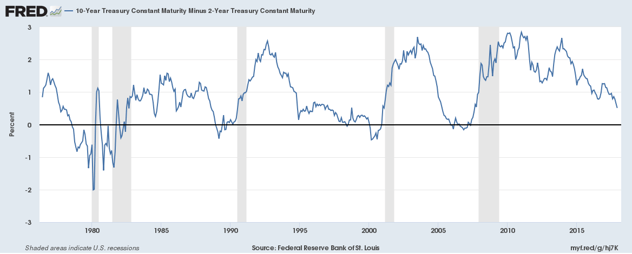
The point of the graph above is straightforward. Historically, the spread between the 10-Year Treasury and 2-Year Treasury has foreshadowed market events. For example, 1978, 1988, 1998, and 2006 are the years when the spread between the 10-Year and 2-Year went to zero (0%). In other words, these are the moments in time when the short-term cost of capital equaled the long-term growth expectation. Within some period of time, the U.S. economy ended up in a recession. As of the end of 2017, the spread between the 10-Year and 2-Year Treasuries was at 0.51%. Not zero… but quite close. Dare I say trending towards zero.
Clearly, I am only showing you four data points and such a small sample size is not enough to prove a point. However, there is a reasonable story today behind the numbers. The Federal Reserve has already signaled to the markets their expectation of raising short-term interest rates two to three times in 2018. Despite this, or maybe because of this, the long end of the Treasury curve has not moved up. At the end of 2017, 10-Year Treasuries continue to be stubbornly stuck below 2.5%.
As I said earlier in this blog, long-term investment success comes from simple concepts and discipline. Plan sponsors can help their participants learn these concepts and be reminded of the disciplines needed through well thought out group education sessions. Two timely topics are strategic asset allocation and rebalancing.
Multnomah Group is a registered investment adviser, registered with the Securities and Exchange Commission. Any information contained herein or on Multnomah Group’s website is provided for educational purposes only and does not intend to make an offer or solicitation for the sale or purchase of any specific securities, investments, or investment strategies. Investments involve risk and, unless otherwise stated, are not guaranteed. Multnomah Group does not provide legal or tax advice.
Any views expressed herein are those of the author(s) and not necessarily those of Multnomah Group or Multnomah Group’s clients.