
Below is a graph depicting the U.S. Treasury Yield Curve as of June 5, 2019:
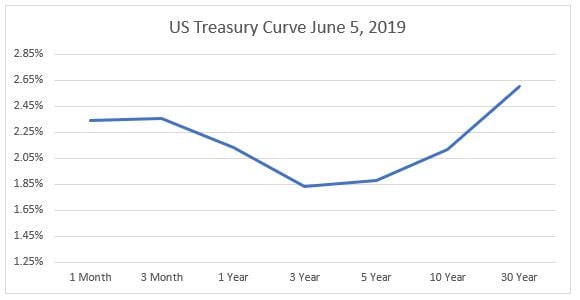
Many of you have likely been hearing more and more about inverted yield curves. An inverted yield curve is when the front end of the above line is higher than the rest of the curve, generally meaning that the market is expecting a cool down in the economy. I am not sure what to call the above curve as it is inverted at some points, but not fully. Primarily, the three- and five-year periods are well below the front and back ends of the curve. Generally speaking, the front end of the yield curve is controlled by the Federal Reserve via the Fed Funds Rate, whereas the rest of the curve is largely dominated by the buying and selling of US. Treasuries.
The Federal Reserve has, at least over the past few months, indicated to the market that they will likely maintain their current Target Range of 2.25% to 2.50% for the remainder of 2019. The market sees the path for interest rates differently from the Federal Reserve. As implied by the December futures contract for Fed Fund Futures, traded at the Chicago Mercantile Exchange, the market is pricing in a 13.9% chance that Fed Funds rate will be decreased down to the 2.00% to 2.25% range. Furthermore, the market is pricing a 32.6% chance that Fed Funds could be as low in the range of 1.75% to 2.00% and 34.0% down to the range of 1.50% to 1.75%. (https://www.cmegroup.com/trading/interest-rates/countdown-to-fomc.html)
When market expectations are not met, the markets have the tendency to reprice, sometimes in dramatic ways. The fixed income market’s current expectation is for the Federal Reserve to lower Fed Funds Rates; and likely, the stock market is pricing in a similar scenario.
Below is a calendar of Federal Open Market Committee (FOMC) meetings:
- June 18-19
- July 30-31
- September 17-18
- October 29-30
- December 10-11
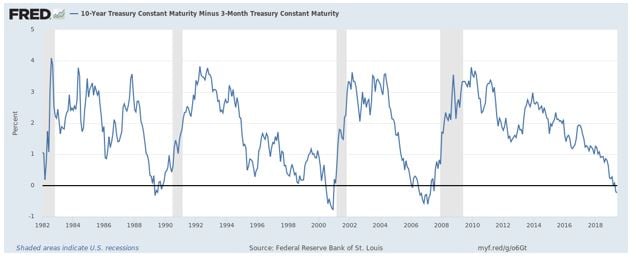
We will all need to stay tuned to see how policy matches (or not) market expectations. Although there are not enough data points for the following point to be statistically valid, it is interesting to note that an inverted yield tends to proceed economic recessions by six to twelve months. Below is a graph from the St. Louis Federal Reserve which shows the spread between the 10 year and three month treasuries. The line being below zero is when the yield curve is inverted. The grey zones are periods of recessions.
Multnomah Group is a registered investment adviser, registered with the Securities and Exchange Commission. Any information contained herein or on Multnomah Group’s website is provided for educational purposes only and does not intend to make an offer or solicitation for the sale or purchase of any specific securities, investments, or investment strategies. Investments involve risk and, unless otherwise stated, are not guaranteed. Multnomah Group does not provide legal or tax advice. Any views expressed herein are those of the author(s) and not necessarily those of Multnomah Group or Multnomah Group’s clients.