

Caryn Sanchez walks through our quarterly market commentary for the second quarter of 2026. You can listen to it here:
Her full coverage is below.
The Economy
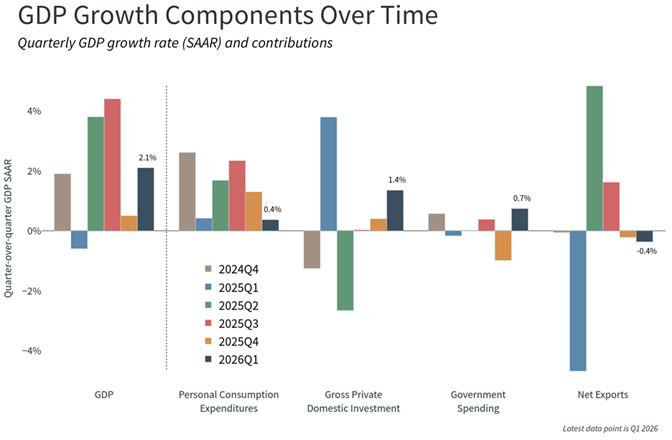
Economic activity continued to expand during the second quarter of 2026, though at a moderate pace. The latest estimate of first-quarter GDP showed annualized growth of 2.1%, up from 0.5% in the fourth quarter of 2025. Business investment, exports, government spending, and consumer spending contributed positively, while higher imports weighed on the calculation. Advance estimates for second-quarter GDP are scheduled for release on July 30.
The labor market remained resilient but showed signs of cooling. Nonfarm payrolls increased by 57,000 in June, and the unemployment rate held at 4.2%, still low by historical standards. Wage growth also moderated, with average hourly earnings rising 3.5% over the twelve months ending in June. Together, these data suggest that labor market imbalances have eased, but employment conditions continued to support growth.
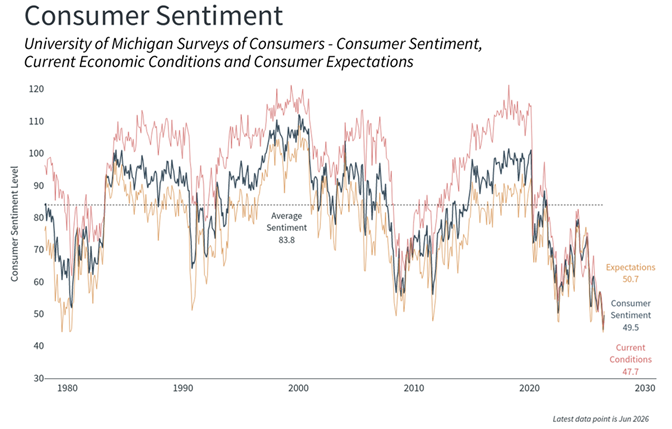
Consumer sentiment remained mixed. The University of Michigan Index of Consumer Sentiment was down 18.5% from June 2025, reflecting pressure from elevated prices, higher borrowing costs, and uncertainty about the outlook. Sentiment improved 10.5% in June, however, potentially reflecting easing near-term concerns and geopolitical developments, including reports of a truce with Iran that reduced fears of broader conflict and energy-market disruption.
Inflation remained above the Federal Reserve’s long-term target. CPI increased 3.5% over the twelve months ending in June, while Core CPI rose 2.6%. Through May, headline PCE inflation was 4.1% year over year, and Core PCE was 3.4%, reinforcing the view that price pressures remained persistent. Overall, the economy continued to grow, but policymakers faced the challenge of balancing slower job growth against inflation that remained above desired levels.
Fixed Income Markets
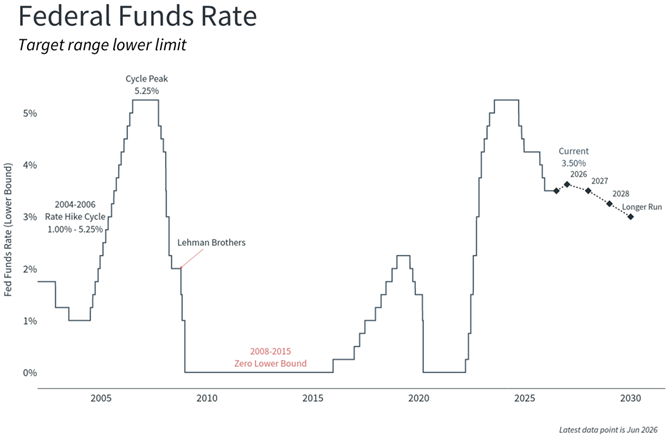
Interest rates remained a central focus for investors. After three Federal Reserve rate cuts in late 2025, the Federal Open Market Committee held the federal funds target range at 3.50% to 3.75% throughout the first half of 2026. The pause reflected a mixed backdrop, with policymakers weighing persistent inflation against generally stable economic and labor market conditions.
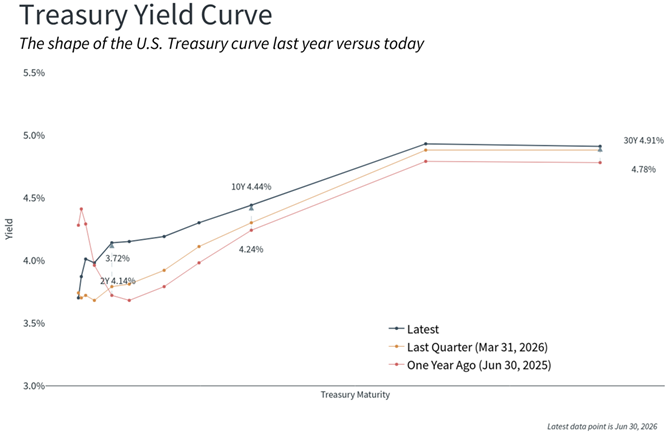
Treasury yields rose across much of the curve during the quarter, particularly at the short end, where rates are more sensitive to expectations for Fed policy. The 2-year Treasury yield ended June at 4.14%, while the 5-year and 10-year yields finished at 4.19% and 4.44%, respectively. The 30-year Treasury yield ended the quarter at 4.91%. Higher yields increased income potential for bond investors but also created short-term price pressure on existing bonds.
Fixed income markets generated modestly positive results. The Bloomberg U.S. Aggregate Bond Index returned 0.7% for the quarter and 3.8% over the trailing year. Risk-oriented sectors generally led, with Emerging Markets Debt and High Yield posting the strongest quarterly results at 3.4% and 2.4%. Over one year, Emerging Markets Debt returned 8.0%, High Yield returned 5.8%, and Mortgage-Backed Securities returned 5.2%.
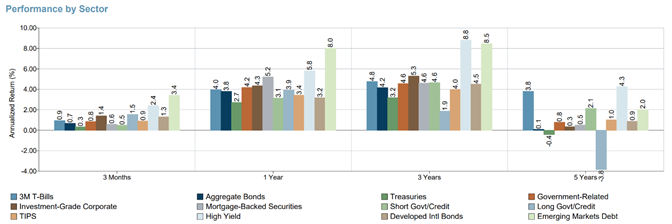
Returns by Sector: 3M T-Bills - USTREAS T-Bill Auction Ave 3 Mon; Aggregate Bonds - Bloomberg US Agg Bond TR USD; Treasuries - Bloomberg US Treasury TR USD; Government-Related - Bloomberg US Agg Govt Reltd TR USD; Investment-Grade Corporate - Bloomberg US Corp Bond TR USD; Mortgage-Backed Securities - Bloomberg US MBS TR USD; Short Govt/Credit - Bloomberg US Govt/Credit 1-3 Yr TR USD; Long Govt/Credit - Bloomberg US Govt/Credit Long TR USD; TIPS - Bloomberg US Treasury US TIPS TR USD; High Yield - Bloomberg US HY Interm TR USD; Developed Intl Bonds - Bloomberg Global Aggregate TR Hdg USD; Emrg Mkts Debt - Bloomberg EM USD Aggregate TR USD Equity Markets
Equity markets advanced sharply in the second quarter, but not without significant intra-period volatility. The S&P 500® returned 15.2% for the period, lifting its trailing one-year return to 22.3%. Sector performance was broadly positive but uneven. Information Technology led with a 31.8% quarterly return and a 37.5% one-year return, while Industrials also posted strong gains. Energy and Utilities were the only sectors in negative territory for the quarter, declining 13.4% and 0.5%, respectively.
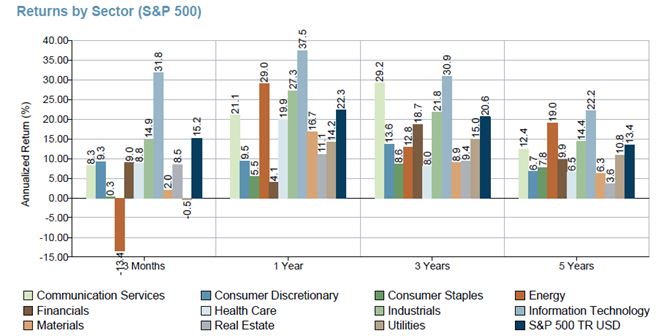
Returns by Sector are represented by the S&P 500 Index sector total return indices
Style and capitalization results showed strong leadership from small-cap stocks. Small Growth returned 25.7% for the quarter, followed by Small Blend at 21.5% and Small Value at 17.2%. Over the trailing year, small-cap value-oriented equities were particularly strong, with Small Value returning 43.0%, Small Blend returning 40.8%, and Small Growth returning 38.7%. Large-cap equities also delivered solid quarterly gains, with Large Growth slightly ahead of Large Blend and Large Value. Mid-cap equities were positive but comparatively weaker.
International equities also participated in the rally. Developed international markets returned 10.5% for the quarter, while emerging markets rose 24.1%. Over the trailing year, emerging markets gained 44.2%, outpacing both U.S. equities and developed international markets. EM Asia was the strongest region, returning 30.3% for the quarter and 49.4% over one year.
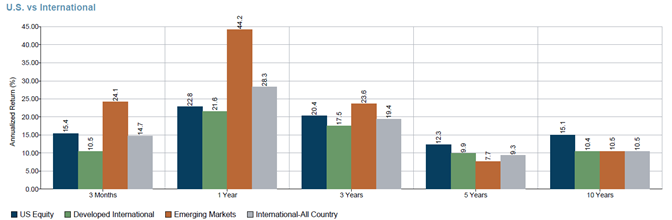
Returns by Market are represented by US Equity - Russell 3000 TR USD; Developed International - MSCI World Ex USA GR USD; Emerging Markets - MSCI EM GR USD; International-All Country - MSCI ACWI Ex USA GR USD
Outlook
Markets are adapting to a changing monetary policy environment following the appointment of Federal Reserve Chairman Kevin Warsh. With the Fed removing forward guidance from its statements and policymakers divided on the path of interest rates, the market may place greater emphasis on incoming data related to inflation, employment, growth, and future policy decisions. This could contribute to intermittent volatility as expectations adjust.
Artificial intelligence remains an important market theme, but investor focus appears to be shifting. Early in the AI cycle, companies with direct AI exposure were broadly rewarded. More recently, performance has begun to diverge as investors evaluate whether large AI-related expenditures can translate into productivity gains, profitability, and durable competitive advantages. The strength of Small Growth stocks may suggest that investors are also looking beyond the largest technology companies for potential beneficiaries of AI adoption.
Another developing theme is the expected return of large private companies to public equity markets. Accelerated index inclusion frameworks could allow certain newly public companies to enter major benchmarks more quickly, potentially influencing capital flows and trading activity after IPOs. SpaceX's June 2026 public offering provided an early example of these dynamics. Although the company entered the market with an estimated valuation of approximately $1.8 trillion, only a relatively small portion of shares was made available for public trading. Because most broad-market indexes weight constituents based on their publicly available share count, or "free float," SpaceX's initial representation in major indexes was considerably smaller than its total market capitalization might suggest. Additional large IPOs may create new opportunities if equity market conditions remain supportive.
Multnomah Group is a registered investment adviser registered with the Securities and Exchange Commission. Any information contained herein or on Multnomah Group’s website is provided for educational purposes only and does not intend to make an offer or solicitation for the sale or purchase of any specific securities, investments, or investment strategies. Investments involve risk and, unless otherwise stated, are not guaranteed. Multnomah Group does not provide legal or tax advice.