
The U.S. economy rose at an annualized pace of 2.0% in the first quarter of 2023, a decrease from the fourth quarter of 2022 when GDP rose 2.6%. First quarter GDP reflected increases in consumer spending, exports, municipal spending, and nonresidential fixed investment. Private inventory investment and residential fixed investments declined. The second quarter GDP will be released on July 27.
Core CPI, which excludes food & energy prices, rose 4.8% in the 12 months through June, down from 5.6% in March but still above the Fed’s target rate of 2.0%. In Fed news, they raised the funds rate by 25 basis points in May but paused increases at their June meeting. Concerns about a potential breach of the debt ceiling led to increased uncertainty about the economy's stability. The Fed also considered the tightening of credit conditions, which may weigh on economic activity. The Fed rate currently holds at 5.0%-5.25%.
Meanwhile in employment, nonfarm payrolls rose by 209,000 in June, with the unemployment rate at 3.6%. Wages grew at an annual rate of 4.4%. Consumer confidence improved modestly in June versus May rates, but forward expectations continue to reflect consumers’ concerns about the potential for a recession.
Bond market returns were down in the second quarter as the broad market Bloomberg U.S. Aggregate Bond index declined 0.8%. Yields rose, continuing to reflect a sharp inversion of the yield curve. The yields on the 2-year, 10-year, and 30-year Treasury issues ended the period at 4.9%, 3.8%, and 3.9%, respectively. Fixed income sector returns were mostly negative for the quarter, with high yield & emerging markets debt and T-bills the only sectors producing positive returns (up 1.8%, 1.5%, and 1.3%, respectively). The largest sector losses were in developed international debt, down 3.1% for the period.
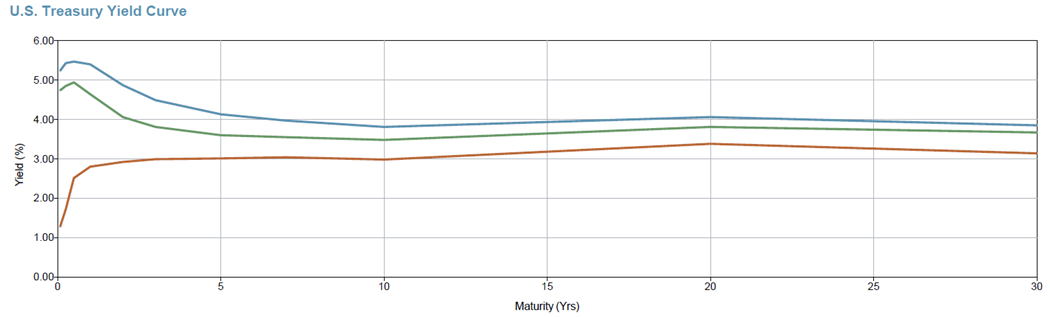
Figure 1: Source MPI Stylus as of June 30, 2023
The S&P 500® was up 8.7% for the second quarter, and sector returns were largely positive. However, market returns were led by a handful of names. The top 10 holdings of the S&P 500® provided approximately two-thirds of the benchmark’s total return. The forward P/E for the S&P 500® ended the quarter at 19.1x, above the 25-year average of 16.8x. However, the current P/E metric is top-heavy as the top 10 holdings of the index boast an average P/E of 20.1x; the remaining stocks in the index have an average of just 15.7x. Technology, consumer discretionary, and communications services stocks produced the best results, up 17.2%, 14.6%, and 13.1%, respectively. Utilities, down 2.5%, and energy stocks, down 0.9%, were the only negatively performing sectors. Growth equities significantly outperformed value across the market capitalization spectrum.
U.S. markets outperformed developed international (up 3.3%) and developed international & emerging markets (up 2.7%) for the second quarter. Emerging market equities were up 1.0%. Latin America, Europe, the Middle East, & African emerging markets boasted positive returns for the period, while Asian emerging markets were down 0.6%. For the year-to-date, China is down 5.4% (in U.S. dollars). The return follows a 21.8% decline for 2022.
The commodities sector was down 7.8% for the year through June 30, a reversal on 2022 results, when commodities led the market, up 16.1% for the year.
Multnomah Group is a registered investment adviser, registered with the Securities and Exchange Commission. Any information contained herein or on Multnomah Group’s website is provided for educational purposes only and does not intend to make an offer or solicitation for the sale or purchase of any specific securities, investments, or investment strategies. Investments involve risk and, unless otherwise stated, are not guaranteed. Multnomah Group does not provide legal or tax advice. Any views expressed herein are those of the author(s) and not necessarily those of Multnomah Group or Multnomah Group’s client.