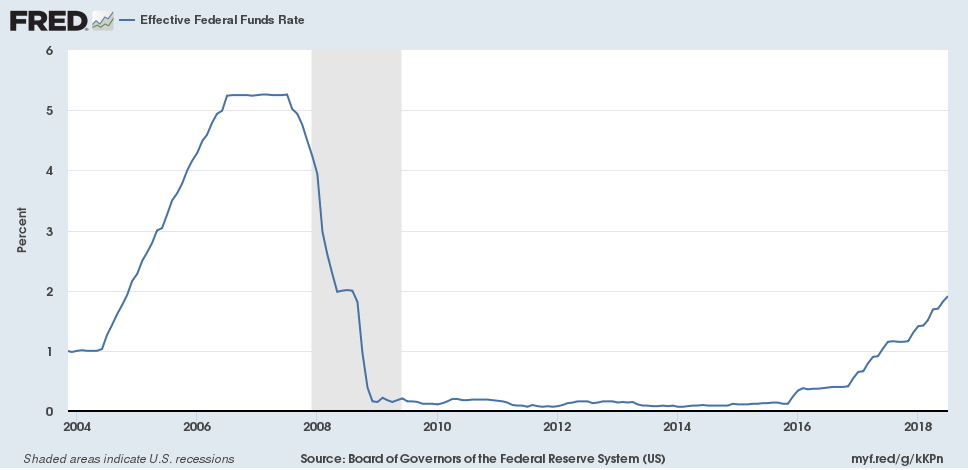
The Federal Reserve (Fed) began raising the Fed Funds Rate, which is the benchmark interest rate banks charge one another for overnight borrowing, in late 2015. Prior to this action, the interest rate had been left near 0% since the early days of the financial crisis in 2008 to encourage economic activity. Beginning in late 2015, the Fed has raised this key rate seven times to its current range of 1.75% to 2.0% (see chart below). Actions by the Fed receive great attention in the press, but they are only part of the story for retirement plan fixed income investors. This blog post will explore how fixed income funds have performed in light of the headline news that ‘interest rates are rising.’

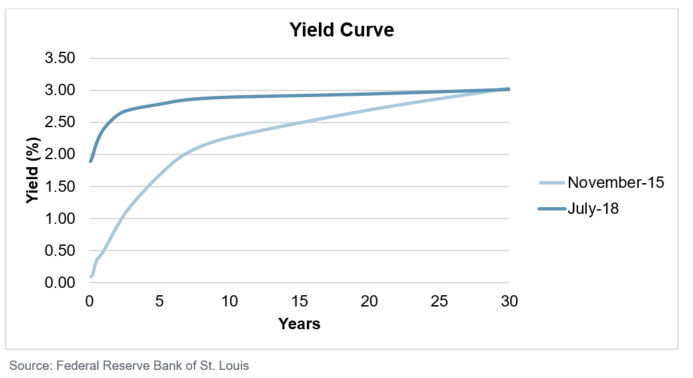
The prior chart provided a narrow view of interest rates – just the very shortest-end of the yield curve, but this serves as a starting point for the full curve. The chart below shows interest rates over the full maturity spectrum of available U.S. Treasury bonds at two points in time – November 2015 (prior to the Fed’s first increase in this current series) and July 2018 (most recent available data). In general, the yield curve has flattened over the last 32 months. This is to say that the increase in bond yields at the short-end of the curve (less than 5 years) is greater than increase at the long-end of the curve (10-30 years). Other common shifts in the yield curve include ‘parallel’ and ‘twists’.

Fixed income investors returns are comprised of two components – coupon payments and bond prices. Rising interest rates have an inverse relationship to bond prices. In other words, as interest rates rise bond prices will generally decline, reducing investment returns. A commonly used measure of a bond fund’s sensitivity to changes in interest rates is duration. Duration, stated in years, indicates how much an investor should expect their portfolio value to change in value if a 1% change in the level of interest rates occurred across the yield curve. For example, if the yield curve shifted up 1%, then a bond fund with a duration of 6[1], then the portfolio would decline in value by approximately 6%. Additional factors (credit quality, inflation, issuer specific factors, etc.) will influence fixed income fund performance but are not covered in this post.
In spite of this rising interest rate environment the past 2+ years, fixed income fund performance hasn’t been awful.
- Money market investors have benefited greatly, as returns for BoA ML 3-month T-bill index has returned 0.75% on an annualized basis. This return is still low but about 15 times greater than the same index returned one-year period ending Dec. 31, 2015. Given the short maturity of money market instruments, money market funds are highly responsive to changes in interest rates.
- Intermediate term bond funds, typically benchmarked against the Bloomberg Barclays Aggregate Bond Index, have experienced positive returns, but the level of returns is low. The index has returned approximately 1.6% annualized over this period. Interest rates in this segment of the curve have risen but given the longer average maturity compared to money markets; fund managers haven’t been able to reinvest as large a percentage of the portfolio at the prevailing higher yields.
- Long-term bond funds, not typically offered in defined contribution retirement plans due to the educational complications and general low utilization of fixed income strategies, have outperformed short- and intermediate-term counterpart. The Barclays Bloomberg U.S. Gov’t./Credit Long index has returned 4.2% annually during the same period. After looking at the changing shape of the yield curve, one could observe that this segment of the fixed income market has not experienced an increase in interest rates as seen in other segments.
It should be noted that rising interest rates do allow for reinvestment of coupon payments and maturing bonds at higher interest rates. So, there may yet be a silver lining to this story.
One thing is for sure, the interest rate market will continue to move. The Fed’s benchmark interest rate is an important signal of the overall direction of interest rates, but don’t let the headlines trick you. It doesn’t tell the full story of interest rates and is just one factor influencing fixed income investments.
Notes:
[1] The Bloomberg Barclays Aggregate Bond Index, a commonly used index for passive bond investors in retirement plans, is approximately 6 currently.
Multnomah Group is a registered investment adviser, registered with the Securities and Exchange Commission. Any information contained herein or on Multnomah Group’s website is provided for educational purposes only and does not intend to make an offer or solicitation for the sale or purchase of any specific securities, investments, or investment strategies. Investments involve risk and, unless otherwise stated, are not guaranteed. Multnomah Group does not provide legal or tax advice.
Any views expressed herein are those of the author(s) and not necessarily those of Multnomah Group or Multnomah Group’s clients.

