
Some indices have come to dominate asset class investing, such as the Russell 1000® Value, used to represent the large cap value asset class, and the MSCI All Country World Index (ACWI) ex-USA to represent international asset classes. While portfolio benchmarks are a useful tool for understanding how well an investment manager has performed, investors must understand that index construction methodologies can lead to structural biases. We expect passive index funds to match the performance of the benchmark they seek to replicate, roughly plus or minus their fund expense ratio. That’s fairly straightforward. However, when we use active managers, we expect them to generate alpha (return in excess of the benchmark) and thus we should expect some portfolio differentiation.
The Russell 1000® index is one of the most common benchmarks for large cap investments; the Russell 1000® Value & Russell 1000® Growth indices are subsets. To obtain the style indices, Russell uses financial ratios including price-to-earnings (P/E), price-to-book (P/B), and dividend yield to determine whether a constituent is classified as a value or growth stock. This calculation methodology results in strong sector biases in both of the style indices. The Russell 1000® Growth is dominated by technology stocks, which make up 32.43% of the index and the Value index is disproportionately exposed to financials at 25.21% of the index (by comparison, the next largest sector in either index comprises less than 15%).
Why is it important to understand these structural biases? Let us look to the foreign large value category and its benchmark, the MSCI ACWI ex-USA Large Value, for a current example. MSCI uses price-to-book, price-to-earnings (forward), and dividend yield to identify the value constituents of the parent index; since financial companies typically have fewer tangible assets, statistically, these companies will often appear “cheap” relative to other market sectors. Accordingly, the MSCI ACWI ex-USA Large Value index has historically demonstrated a strong bias to financials, which currently comprise 39.87% of the index. Many investment managers seek to mitigate portfolio risk through sector diversification and manage sector exposures with either an absolute or benchmark-relative constraint. Several of the foreign large value investment managers we’ve spoken with in the last few months have expressed concern about the benchmark’s heavy weight to financials and are holding relatively smaller amounts in the sector. Indeed, peer group’s average weight to financials is just 23.31%.
For the one-year period ended July 31, financials have been one of the best performing sectors of the MSCI ACWI ex-USA Large Value Index, boasting a return of 35.94%. Given the lower average weight to financials, it is unsurprising that the peer group, on average, underperformed the benchmark by more than 390 basis points.
See chart:
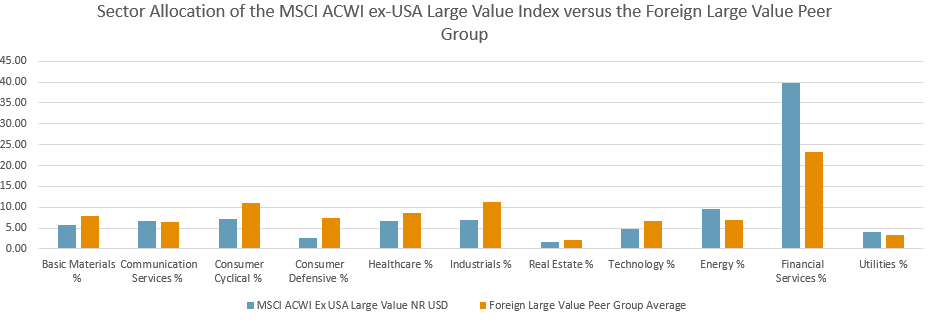
Click on the chart for a larger image.
Please note: Peer group and index performance information provided is as of July 31, 2017. Peer group and index breakdowns by sector are based on long-only holdings. Peer group and index data provided by Morningstar.
Multnomah Group is a registered investment adviser, registered with the Securities and Exchange Commission. Any information contained herein or on Multnomah Group’s website is provided for educational purposes only and does not intend to make an offer or solicitation for the sale or purchase of any specific securities, investments, or investment strategies. Investments involve risk and, unless otherwise stated, are not guaranteed. Multnomah Group does not provide legal or tax advice.
Any views expressed herein are those of the author(s) and not necessarily those of Multnomah Group or Multnomah Group’s clients.